

Standard AI Visibility Reporting Breaks at Enterprise Scale
By Luke Rodski • August 18, 2026 • 7 min
Article Highlights:
- Off-the-shelf AI visibility tools show what appears in LLM responses, but they rarely explain why the result changed or how to influence it.
- Enterprise teams need reporting that reflects the prompts, content, placements, and business questions behind the specific strategy they are executing.
- Rolled-up visibility scores can hide which content improved the result, which had little effect, and which worked against the campaign.
- Use standard reporting for the baseline and custom reporting to diagnose causes, guide content changes, and measure specific strategies.
We have a client with an established presence in LLM responses.
Visibility wasn’t their main concern.
Instead, they wanted to know how they were showing up, which resources were being cited, how much citation share those resources had, and how that content was affecting sentiment.
Their off-the-shelf reporting tool could describe the what: which citations appeared and how much citation share each domain had. With topic-based prompt sets, it could also show which topics had higher visibility or citation share.
But it couldn’t tell them why those results were happening or what their own content needed to say to improve them.
So they could make an educated guess and adjust their strategy by topic. But they still couldn’t see what the content needed to include, what it should emphasize, or how it should reference the brand to improve results.
That’s where standard reporting fails our enterprise teams: when the question moves from what is happening to how to change it.
General AI Visibility Reporting Can’t Answer Enterprise Questions
Our enterprise clients don’t all have the same visibility problem, so they don’t all need the same reporting.
One client might not be showing up in the text at all. Another might have a well-established presence but need to worry about sentiment and how the brand is showing up.
While a standard off-the-shelf LLM visibility tool can address both at a high level, getting granular is difficult.
Depending on the industry and the topics a client wants to focus on, they might need different content formats or different subject matter to address the problem.
General-purpose tools don’t have that industry knowledge. They report whether and where a brand appears, rolled up into high-level statistics like citation share. What they don't do is tell you what your content needs to say to change the result.
They aren’t considering the business type, the density of the competitive space, how competitors approach the market, or which parts of the client’s content strategy they can change.
When businesses get serious about visibility, they’re asking more granular questions like: “I’ve made updates to pages X, Y, and Z. Which is now the most citable? Which is leading to the greatest shift in visibility? Are any of these changes having a negative impact?”
They want to understand the results of the strategy they’re employing and how that should shape the strategy going forward.
Answering those questions requires more than general visibility reporting.
Standard Reporting Doesn't Automatically Map to Your Visibility Campaigns
Off-the-shelf AI visibility tools aren't useless. They're good at answering what's going on.
They can help you define the prompts, topic spaces, and buyer language you want to track. From there, they can show where you’re visible, where the gaps are, and how much of the cited content comes from your domain or other sites you control.
That gives you a starting point.
Using that information, you can audit your existing visibility and determine whether the problem is showing up in the text, negative sentiment, or another addressable gap.
Where platform reporting becomes less useful is strategy and impact.
Most tools track prompts, visibility scores, citations, and high-level sentiment. But you can reach a dead end where you have the numbers and don't know what work needs to be done with them.
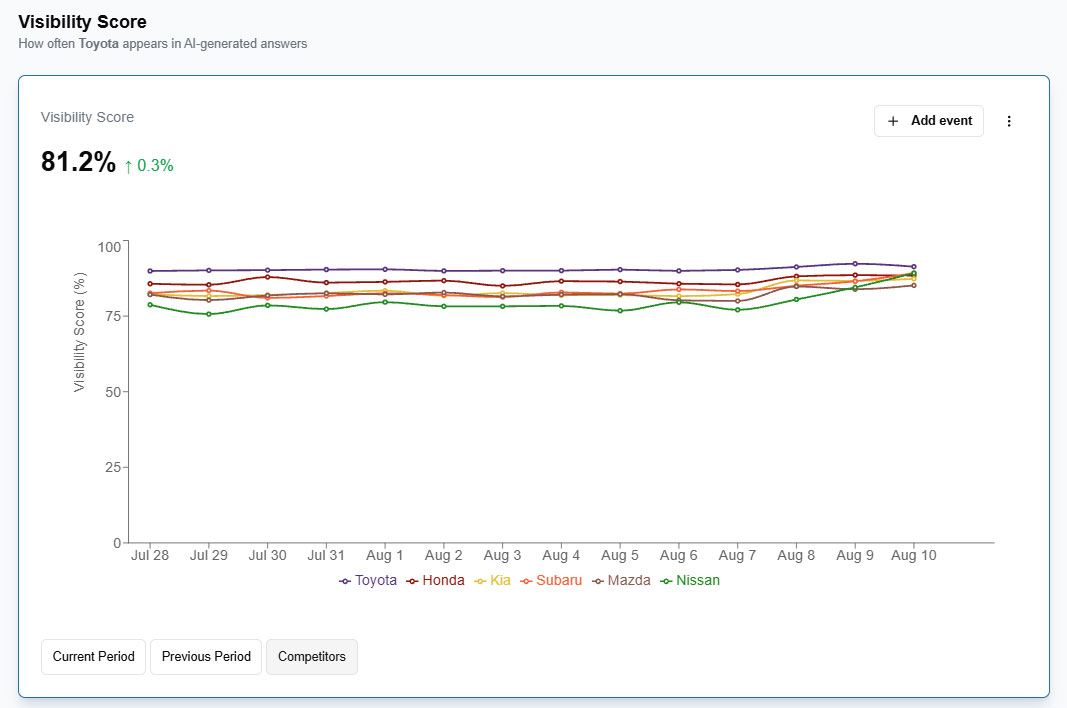
That number doesn't tell you what work to do next or account for the decisions your team is willing to make.
For that, you need expert judgment.
If sentiment is the primary concern, for example, you may need to compare positive and negative phrases in the response text, break sentiment down by competitor, and compare the response with the actual content on the pages being cited.
That level of analysis usually doesn't appear in a standard, generic dashboard.
And once you're deploying content, the reporting also needs to connect back to the strategy. Without that connection, you don’t know the impact of the work. You need a before-and-after picture to understand whether you moved the needle and whether that movement came from the content or strategy you employed.
Otherwise, you know the numbers changed…but future decisions become guesswork.
Define the Question Before You Build the Visibility Reporting
Before you build custom reporting, define the specific question you need it to answer:
- Are you trying to understand why sentiment is negative?
- Which content is influencing citations?
- Did a specific campaign change visibility?
The question determines the prompts, data, and reporting you need.
Some clients know the visibility problem, the competitor that’s beating them, and the prompts they want to rank for. Others don’t know what they should be targeting yet. They need help finding the queries they’re losing on and their biggest addressable gaps.
Our team at Xofu.Dev works with these teams to help them identify what they should focus on.
Often, our clients know what their current tool failed to show them. They may understand that sentiment is the problem but still need more detail on how the brand is being discussed and what’s influencing those responses.
From there, we can build the prompt set and run a baseline survey across visibility, sentiment, and citation share. We also need to understand the client’s content strategy, what they’re publishing now, and which surfaces we can advise on and control. That could include their website, LinkedIn content, YouTube, or other channels.
The opportunity map helps determine what belongs in the reporting.
Use this sequence to build out your reporting:
- Define the question
- Establish the baseline
- Identify the opportunity
- Decide what you can change
- Build the reporting around that strategy.
- Once the work is deployed, track the same question over time so you can decide what to repeat, change, or stop.
Different customer groups may use different prompts and phrases when searching for the same product. If the data shows a gap with one group, we can design the prompts and content strategy around that opportunity.
It’s an iterative process that doesn't replace the standard platform. Instead, it builds on the same visibility, citation, and sentiment data, then analyzes and structures it around the specific question you're trying to answer.
We bring the initial findings back to the client, discuss the biggest gaps, and decide which solutions they’re willing to employ. The reporting then changes based on what’s working and what isn’t.
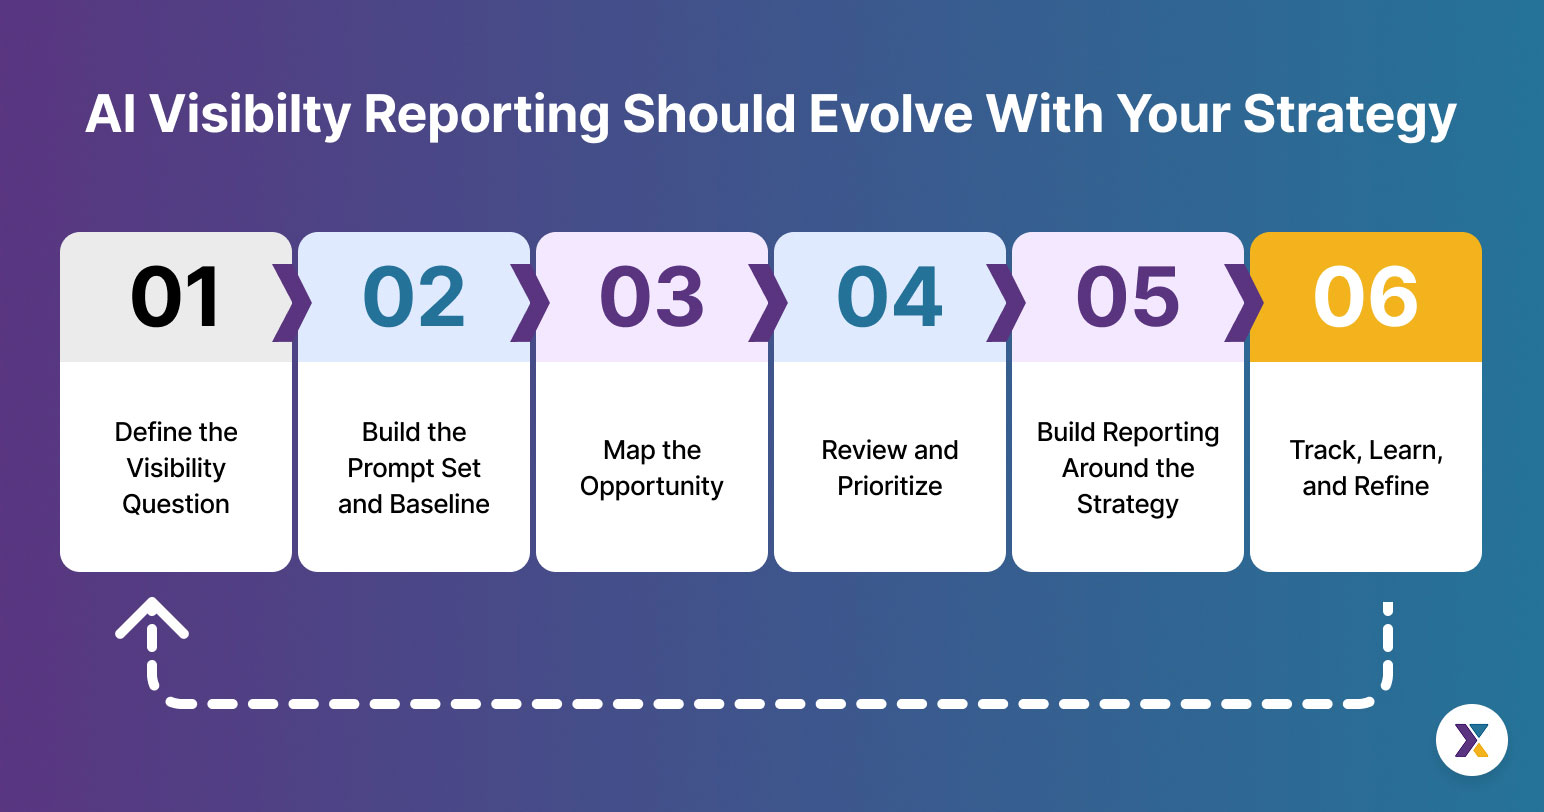
The dashboard supports that ongoing advisory work. It gives the client an organized view of the metrics they care about while helping our team refine the strategy without requiring them to dig through the underlying data.
If we deploy several content types around one feature, we can track them against the same prompt set. If one format is cited more frequently, we may allocate more resources to it in the next round.
We usually need around a month to see what the LLMs pick up and whether those citations continue week over week. That client feedback and iteration is what off-the-shelf reporting doesn’t bake in.
Misaligned Reporting Leads to Weak Campaign Decisions
When reporting isn’t built around the strategy, everything gets blended into one rolled-up visibility number.
That number might go up, but you still don’t know which content moved visibility in a positive direction and which content brought it down.
If you can’t identify what contributed most to the gain, you can’t reliably replicate it.
Say you publish 100 articles and visibility increases by five points. Maybe 80 articles helped while the other 20 reduced the potential gain. You could have had a ten-point increase, but the rolled-up number doesn’t show that part of the strategy is working against you.
You need a clearer before-and-after picture.
If you update a page, you want to compare how it appeared in LLM responses before and after the change, ideally at a similar volume.
The core data is the response text: how the brand was discussed and, when the response ranks brands, where it appeared against competitors and what the LLM referenced to explain that order.
Without that detail, you only know what the strategy did as a lump sum.
You could be investing in content that brings your visibility down, and any gains you repeat may be more luck than strategy.
Without that detail, teams can’t reliably decide which content to repeat, which changes to reverse, or where to allocate resources in the next round.
To discuss custom reporting and AI consulting to improve how your brand appears in AI answers, reach out to our team.

Luke Rodski
Luke Rodski is a software engineer at Citation Labs who helped build Xofu from the ground up. His work spans the full stack: the pipelines that collect and organize AI visibility data, the features that surface it to clients, and the custom reporting that helps teams turn that data into decisions.
He has shipped features for enterprise clients and everyday users alike, building software that makes complex data usable.